You are looking at the documentation of a prior release. To read the documentation of the latest release, please visit here.
New to Voyager? Please start here.
Profiling Voyager operator
Voyager operator serves runtime profiling data in the format expected by the pprof visualization tool on port :8443. The handled paths all begin with /debug/pprof/.
Follow the steps below to expose profiling data:
- Give
system:anonymoususer access to/debug/pprof/paths. This is not safe to do on a production cluster.
apiVersion: rbac.authorization.k8s.io/v1
kind: ClusterRole
metadata:
  name: appscode:system:profiler
rules:
- nonResourceURLs: ["/debug/pprof/", "/debug/pprof/*"]
  verbs: ["get", "post"]
---
apiVersion: rbac.authorization.k8s.io/v1
kind: ClusterRoleBinding
metadata:
  name: appscode:system:profiler
roleRef:
  apiGroup: rbac.authorization.k8s.io
  kind: ClusterRole
  name: appscode:system:profiler
subjects:
- apiGroup: rbac.authorization.k8s.io
  kind: User
  name: system:anonymous
$ kubectl auth reconcile -f docs/examples/monitoring/profiler.yaml
clusterrole.rbac.authorization.k8s.io "appscode:system:profiler" reconciled
clusterrolebinding.rbac.authorization.k8s.io "appscode:system:profiler" reconciled
- Now, forward the port
:8443to your workstation.
$ kubectl get pods -n kube-system | grep voyager
voyager-operator-f89dcccdb-plvmt        1/1       Running   0          27m

$ kubectl port-forward -n kube-system voyager-operator-f89dcccdb-plvmt 8443
Forwarding from 127.0.0.1:8443 -> 8443
Forwarding from [::1]:8443 -> 8443
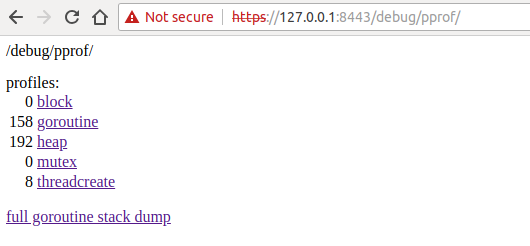
- Now, visit the url: https://127.0.0.1:8443/debug/pprof/
To look at a 30-second CPU profile:
$ go tool pprof https+insecure://localhost:8443/debug/pprof/profile
Entering interactive mode (type "help" for commands, "o" for options)
(pprof) top10
(pprof) pdf
To look at the heap profile:
$ go tool pprof https+insecure://localhost:8443/debug/pprof/heap
(pprof) top10
(pprof) pdf
- Once you are done, remove access to
system:anonymoususer.
$ kubectl delete -f docs/examples/monitoring/profiler.yaml
clusterrole.rbac.authorization.k8s.io "appscode:system:profiler" deleted
clusterrolebinding.rbac.authorization.k8s.io "appscode:system:profiler" deleted